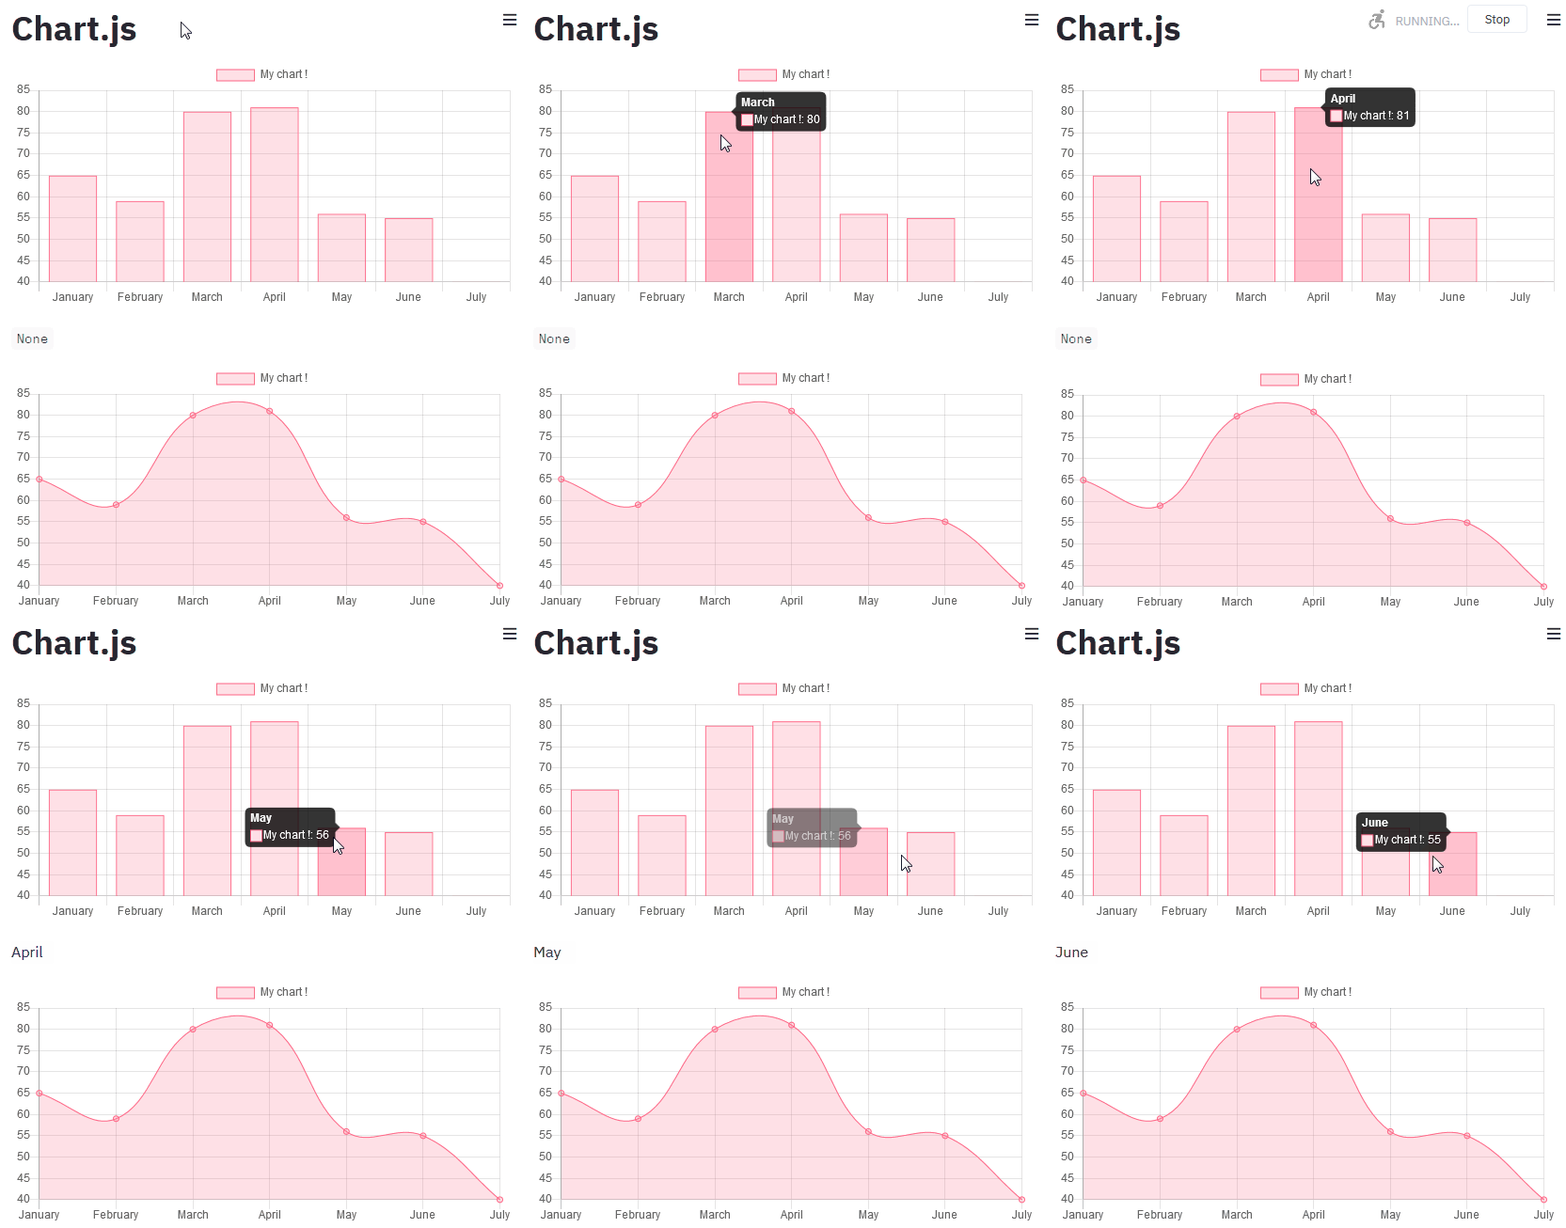
Integrate any React component / Javascript library - Chart.js example
If you’ve come this far, you should understand how easy it is to grab a React component and wrap it into the Streamlit React template. With a few lines of code, you can interface any React component from the community to Streamlit calls.
React’s ecosystem is huge! Check out the Awesome React Components list for a sample. A lot of those components can be added into the Streamlit user experience.
Is there a JS charting library that you like? Many visualization libraries have a React component where data, plot, and event callback configurations are passed through props (just like our baseui slider).
Let’s quickly build a Streamlit bridge into a React library for Chart.js, by copying the Bar and Line Chart examples, and then adding a mouse event to get back the label of the clicked chart element into Streamlit:
# Install JS dependencies
$ cd frontend
$ npm install --save react-chartjs-2 chart.js
StreamlitChart.tsx
import React, { useEffect } from "react";
import {
  ComponentProps,
  withStreamlitConnection,
  Streamlit,
} from "./streamlit";

import { Bar, Line } from "react-chartjs-2";

const StreamlitChart = (props: ComponentProps) => {
  // Destructure arguments sent from Python
  const { title, labels, data, chartType } = props.args;

  // Build data prop for Chart.js component
  // NB: This preprocessing could be done at the Python wrapper level to minimize preprocessing in Javascript
  // Up to the challenge ;) ?
  const dataset = {
    labels: labels,
    datasets: [
      {
        label: title,
        backgroundColor: "rgba(255,99,132,0.2)",
        borderColor: "rgba(255,99,132,1)",
        borderWidth: 1,
        hoverBackgroundColor: "rgba(255,99,132,0.4)",
        hoverBorderColor: "rgba(255,99,132,1)",
        data: data,
      },
    ],
  };

  // Define callback when clicking on an element
  // Sends back the index of the selected bar to Streamlit
  const handleClick = (e: any) => {
    Streamlit.setComponentValue(labels[e[0]["_index"]]);
  };

  // Define a function which returns a JSX block depending on chartType prop
  const renderPlot = () => {
    if (chartType === "bar") {
      return <Bar data={dataset} getElementAtEvent={handleClick} />;
    } else if (chartType === "line") {
      return <Line data={dataset} getElementAtEvent={handleClick} />;
    }
  };

  // After the chart has rendered, update the iFrame height
  useEffect(() => Streamlit.setFrameHeight());

  // Return the graph
  return <div>{renderPlot()}</div>;
};

export default withStreamlitConnection(StreamlitChart);
index.tsx
import React from "react";
import ReactDOM from "react-dom";
import StreamlitChart from "./StreamlitChart";

ReactDOM.render(
  <React.StrictMode>
    <StreamlitChart />
  </React.StrictMode>,
  document.getElementById("root")
);
__init__.py
# To write a little less text, let's run directly from __init__.py instead of app.py
# run with "streamlit run __init__.py"
import streamlit as st
import streamlit.components.v1 as components

_component_func = components.declare_component(
    "chartjs",
    url="http://localhost:3001",
)

def _plot(title, labels, data, chart_type):
    selected_label = _component_func(title=title, labels=labels, data=data, default=None, chartType=chart_type)
    return selected_label

def st_bar(title, labels, data):
    return _plot(title, labels, data, "bar")

def st_line(title, labels, data):
    return _plot(title, labels, data, "line")

st.title("Chart.js")
labels = ['January', 'February', 'March', 'April', 'May', 'June', 'July'];
data = [65, 59, 80, 81, 56, 55, 40]

selected = st_bar("My chart !", labels, data)
st.write(selected)
st_line("My chart !", labels, data)

You’re welcome to grab the code setup from the part4 branch of the project to start :
git clone https://github.com/andfanilo/streamlit-custom-slider
git checkout part4
cd streamlit_custom_slider/frontend
npm install